Market Outlook
September 30, 2016
Market Cues
Domestic Indices
Chg (%)
(Pts)
(Close)
Indian markets are likely to open on a negative note considering domestic and
BSE Sensex
(1.6)
(465)
27,828
global cues.
Nifty
(1.8)
(154)
8,591
Mid Cap
(3.6)
(482)
12,915
The US markets witnessed a selloff fuelled by investor worry about European banks
and talk of a December rate increase by the Fed. Investors were worried about
Small Cap
(4.0)
(525)
12,515
Deutsche BankAG, which has been buffeted by concerns about the health of its
Bankex
(2.4)
(546)
21,910
balance sheet, specifically its ability to withstand a potential $14 billion fine from the
U.S. Justice Department. The US economic data released yesterday showed that US
Global Indices
Chg (%)
(Pts)
(Close)
economy continues to improve which further sparked rate hike fears.
Dow Jones
(1.1)
(196)
18,143
The UK markets rallied yesterday with resource companies leading the charge as
Nasdaq
investors cheered a decision by the Organization of the Petroleum Exporting
(0.9)
(49)
5,269
Countries to cap oil output. The FTSE 100 index rallied 1% to 6,919 to close at its
FTSE
1.0
70
6,919
highest level since Aug 2015. The positive day in London came after OPEC’S to limit
Nikkei
1.4
228
16,694
oil production by about 700,000 barrels a day. Analysts however remain sceptical
Hang Seng
0.5
120
23,739
that the world’s biggest cartel will implement the agreement to limit production
Shanghai Com
0.4
11
2,998
during its November meeting.
Indian equity indices slumped the most on Thursday since the Brexit decision in June
Advances / Declines
BSE
NSE
to their lowest close in more than a month, rattled by the Indian army’s attacks on
the terrorist camps in Pakistan.
Advances
423
126
Declines
2,346
1,532
News Analysis
Unchanged
180
47
Tata Steel plans to add 6 MT in capacity through Brownfield expansion
Automakers smell ` 13,000cr opportunity in Uber’s India expansion
Detailed analysis on Pg2
Volumes (` Cr)
BSE
5,428
Investor’s Ready Reckoner
NSE
45,011
Key Domestic & Global Indicators
Stock Watch: Latest investment recommendations on 150+ stocks
Net Inflows (` Cr)
Net
Mtd
Ytd
Refer Pg5 onwards
FII
806
5,135
45,803
Top Picks
MFs
161
1,518
11,627
CMP
Target
Upside
Company
Sector
Rating
(`)
(`)
(%)
Amara Raja Batteries Auto & Auto Ancillary
Buy
998
1,174
17.6
Top Gainers
Price (`)
Chg (%)
HCL Tech
IT
Buy
792
1,000
26.2
Religare
275
3.9
Bharat Electronics
Capital Goods
Accumulate
1,232
1,414
14.7
Balkrisind
914
2.8
Equitas Holdings
Financials
Buy
170
235
38.5
Infratel
371
2.1
Navkar Corporation Others
Buy
182
265
45.8
More Top Picks on Pg3
Ttkprestig
5,040
1.7
Naukri
860
1.3
Key Upcoming Events
Previous
Consensus
Date
Region
Event Description
Reading
Expectations
Top Losers
Price (`)
Chg (%)
Sep 30 UK
GDP (YoY)
2.2
2.2
Jetairways
463
(12.2)
Oct 01 UK
PMI Manufacturing
53.3
--
Rcom
43
(11.0)
Oct 03 China
PMI Manufacturing
50.4
50.4
Sintex
73
(10.5)
Oct 03 Germany
PMI Manufacturing
54.3
--
Marksans
49
(10.3)
Oct 04 India
RBI Reverse Repo rate
6.0
--
Oct 04 India
RBI Repo rate
6.5
6.4
Dlf
140
(10.2)
As on September 29, 2016
Oct 04 India
RBI Cash Reserve ratio
4.0
4.0
More Events on Pg4
Market Outlook
September 30, 2016
News Analysis
Tata Steel plans to add 6 MT in capacity through Brownfield
expansion
Tata Steel has planned to add 6 MT steel output to its existing 13 MT capacity
across two facilities at Jamshedpur and Kalinganagar through Brownfield
expansion over the next few years. Of the proposed expansion, 1 MT would be
added to Jamshedpur and 5MT would be added at Kalinganagar steel project.
Tata Steel’s focus is to achieve full capacity of phase-I at Kalinganagar plant,
which is running at 60 to 70% of the rated capacity. This month it would be
making 1.6 L to 1.7 L tonne of steel at Kalinganagar which would go up to 2.5 L
tonne per month by March, 2017. Overall this facility will be producing 1.5 MT
steel in this financial year.
A good monsoon is expected to boost demand in the rural areas which is reflected
in higher sales of tractors and two wheelers and lately in commercial vehicles.
Besides, the government’s emphasis on building rail and power transmission
network will lift up steel demand benefitting steel manufacturers such as Tata Steel.
Automakers smell
`
13,000cr opportunity in Uber’s India
expansion
Uber Technologies is charting a major expansion in India, which is expected to
benefit automobile industry. The company is planning to buy about 200,000
passenger vehicles over the next two years to expand in India which is expected to
be a ` 13,000cr opportunity for Indian automobile makers. Rival Ola recently
signed a deal, potentially worth ` 2,600cr, with M&M to purchase 40,000 vehicles
in two years for its driver-partners.
With the concept of shared mobility increasingly gaining acceptance and making
major strides within the country, the share of fleet sales in overall passenger
vehicles sales has grown to 10-12%, or 20,000-25,000 units a month, from 2-3%
five years back. With the fleet market posting annual growth in excess of 15-20%
over the past few years, compared with low single-digit growth seen in the auto
industry, manufacturers from Toyota to Tata, Mahindra and Nissan have been
forming alliances with Ola and Uber. Uber’s fleet expansion plan will provide an
impetus to vehicle makers, further boosting sales at a time when the industry has
already come out of years of slow growth.
Economic and Political News
GST Council to meet tomorrow to discuss rules, exemptions
PSBs heading to driverless state, succession plan needed: RBI Deputy
Governor SS Mundra
Goldman says OPEC deal to add as much as $10 to H1 2017 oil prices
Corporate News
RIL may invest in mature start-ups to deploy ` 5,000cr fund
Lupin gets USFDA nod for generic drug treating Alzheimer's
Welspun to make steel billets, TMT rebars in Odisha
Market Outlook
September 30, 2016
Top Picks
Large Cap
Market Cap
CMP
Target
Upside
Company
Rationale
(` Cr)
(`)
(`)
(%)
To outpace battery industry growth due to better technological
Amara Raja Batteries
17,048
998
1,174
17.6
products leading to market share gains in both the
automotive OEM and replacement segments.
Uptick in defense capex by government when coupled with
Bharat Electronics
29,575
1,232
1,414
14.7
BELs strong market positioning, indicate that good times are
ahead for BEL.
The stock is trading at attractive valuations and is factoring all
HCL Tech
1,11,795
792
1,000
26.2
the bad news.
Back on the growth trend, expect a long term growth of 14%
Infosys
2,36,562
1,030
1,370
33.0
to be a US$20bn in FY2020.
Source: Company, Angel Research
Mid Cap
Market Cap
CMP
Target
Upside
Company
Rationale
(` Cr)
(`)
(`)
(%)
Among the top 4 players in the consumer durables segment.
Bajaj Electricals
2,546
252
306
21.5
Improved profitability backed by turn around in E&P
segment. Strong order book lends earnings visibility.
Favourable outlook for the AC industry to augur well for
Cooling products business which is out pacing the market
Blue Star
5,200
545
578
5.9
growth. EMPPAC division's profitability to improve once
operating environment turns around.
With a focus on the low and medium income (LMI) consumer
Dewan Housing Finance
7,953
273
325
19.2
segment, the company has increased its presence in tier-II &
III cities where the growth opportunity is immense.
Strong loan growth backed by diversified loan portfolio and
adequate CAR. ROE & ROA likely to remain decent as risk of
Equitas Holdings
5,690
170
235
38.5
dilution remains low. Attractive valuations considering
growth.
Expectations of above average monsoon augurs well for
Goodyear India
1,484
643
684
6.3
Goodyear India as it derives ~50% of its turnover from farm
tyre segment.
Economic recovery to have favourable impact on advertising
& circulation revenue growth. Further, the acquisition of a
Jagran Prakashan
5,989
183
225
22.8
radio business (Radio City) would also boost the company's
revenue growth.
Speedier execution and speedier sales, strong revenue
Mahindra Lifespace
1,755
428
522
22.1
visibilty in short-to-long run, attractive valuations
Massive capacity expansion along with rail advantage at ICD
Navkar Corporation
2,593
182
265
45.8
as well CFS augurs well for the company
Earnings boost on back of stable material prices and
Radico Khaitan
1,495
112
125
11.3
favourable pricing environment. Valuation discount to peers
provides additional comfort
Strong brands and distribution network would boost growth
Siyaram Silk Mills
1,186
1,265
1,469
16.1
going ahead. Stock currently trades at an inexpensive
valuation.
Market leadership in Hindi news genre and no. 2 viewership
ranking in English news genre, exit from the radio business,
TV Today Network
1,773
297
363
22.1
and anticipated growth in ad spends by corporates to benefit
the stock.
Source: Company, Angel Research
Market Outlook
September 30, 2016
Key Upcoming Events
Global economic events release calendar
Bloomberg Data
Date
Time
Country
Event Description
Unit
Period
Last Reported
Estimated
Sep 30, 2016
2:00 PM
UK GDP (YoY)
% Change
2Q F
2.20
2.20
Oct 01, 2016
2:00 PM
UK PMI Manufacturing
Value
Sep
53.30
Oct 03, 2016
6:30 AM
China PMI Manufacturing
Value
Sep
50.40
50.40
1:25 PM Germany PMI Manufacturing
Value
Sep F
54.30
Oct 04, 2016
11:00 AM India RBI Reverse Repo rate
%
Oct 4
6.00
11:00 AM India RBI Repo rate
%
Oct 4
6.50
6.38
11:00 AM India RBI Cash Reserve ratio
%
Oct 4
4.00
4.00
Oct 05, 2016
1:25 PM Germany PMI Services
Value
Sep F
50.60
Oct 07, 2016
2:00 PM
UK Industrial Production (YoY)
% Change
Aug
2.10
6:00 PM
US Change in Nonfarm payrolls
Thousands
Sep
151.00
175.00
6:00 PM
US Unnemployment rate
%
Sep
4.90
4.90
Oct 10, 2016
India Imports YoY%
% Change
Sep
(14.09)
India Exports YoY%
% Change
Sep
(0.30)
Oct 12, 2016
China Exports YoY%
% Change
Sep
(2.80)
Oct 13, 2016
5:30 PM
India Industrial Production YoY
% Change
Aug
(2.40)
Oct 14, 2016
US Producer Price Index (mom)
% Change
Sep
(0.30)
12:00 PM
India Monthly Wholesale Prices YoY%
% Change
Sep
3.74
7:00 AM
China Consumer Price Index (YoY)
% Change
Sep
1.30
Oct 17, 2016
2:30 PM Euro Zone Euro-Zone CPI (YoY)
%
Sep F
0.20
6:45 PM
US Industrial Production
%
Sep
(0.43)
Source: Bloomberg, Angel Research
Market Outlook
September 30, 2016
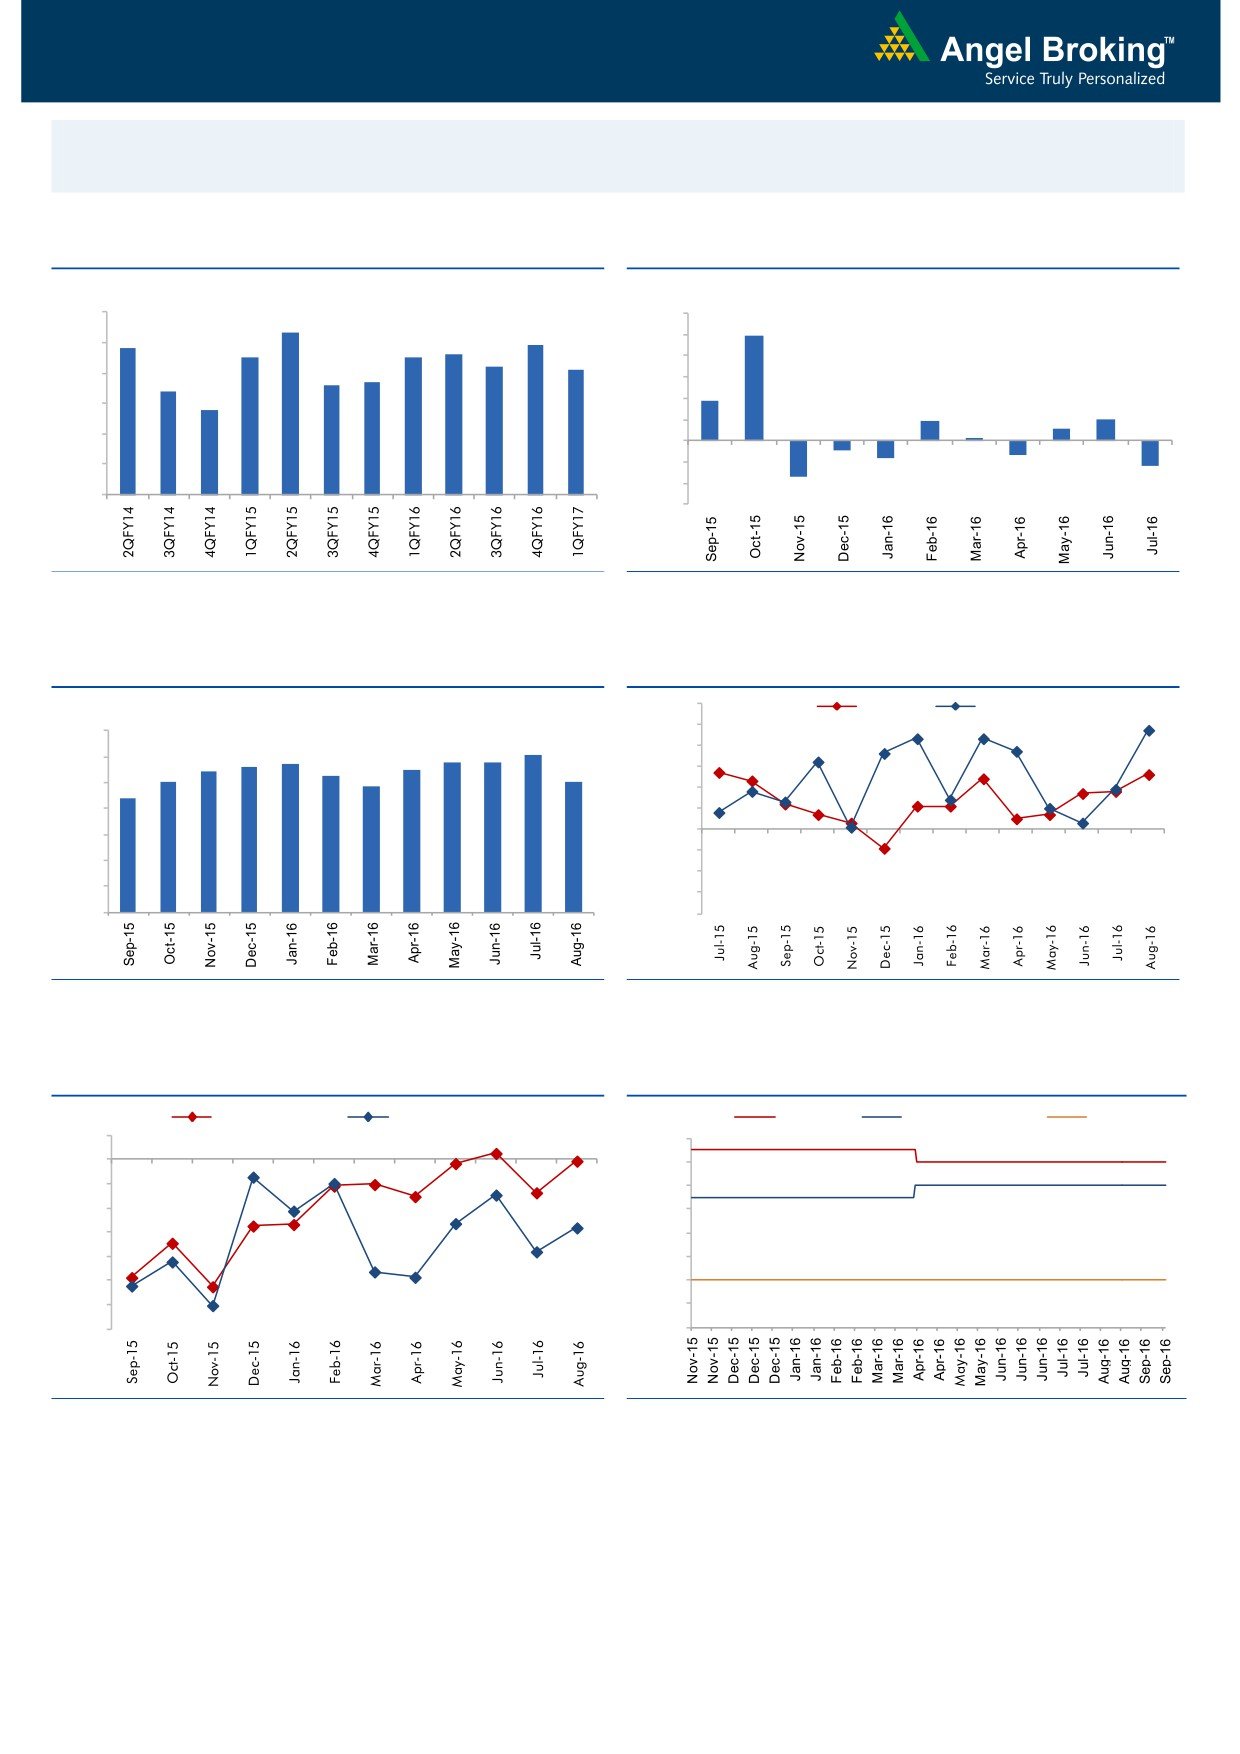
Macro watch
Exhibit 1: Quarterly GDP trends
Exhibit 2: IIP trends
(%)
(%)
9.0
12.0
8.3
9.9
7.8
7.9
8.0
7.5
7.5
7.6
10.0
7.2
7.1
8.0
6.6
6.7
7.0
6.4
6.0
3.7
5.8
6.0
4.0
1.9
2.0
1.1
2.0
0.3
5.0
-
4.0
(2.0)
(0.9)
(1.3)
(1.6)
(4.0)
(2.4)
3.0
(3.4)
(6.0)
Source: CSO, Angel Research
Source: MOSPI, Angel Research
Exhibit 3: Monthly CPI inflation trends
Exhibit 4: Manufacturing and services PMI
56.0
Mfg. PMI
Services PMI
(%)
55.0
7.0
6.1
5.7
5.8
5.8
54.0
6.0
5.4
5.6
5.5
5.0
5.3
5.1
53.0
4.8
5.0
4.4
52.0
4.0
51.0
50.0
3.0
49.0
2.0
48.0
1.0
47.0
-
46.0
Source: MOSPI, Angel Research
Source: Market, Angel Research; Note: Level above 50 indicates expansion
Exhibit 5: Exports and imports growth trends
Exhibit 6: Key policy rates
(%)
Exports yoy growth
Imports yoy growth
(%)
Repo rate
Reverse Repo rate
CRR
5.0
7.00
0.0
6.50
(5.0)
6.00
(10.0)
5.50
(15.0)
5.00
(20.0)
4.50
(25.0)
4.00
(30.0)
3.50
(35.0)
3.00
Source: Bloomberg, Angel Research
Source: RBI, Angel Research
Market Outlook
September 30, 2016
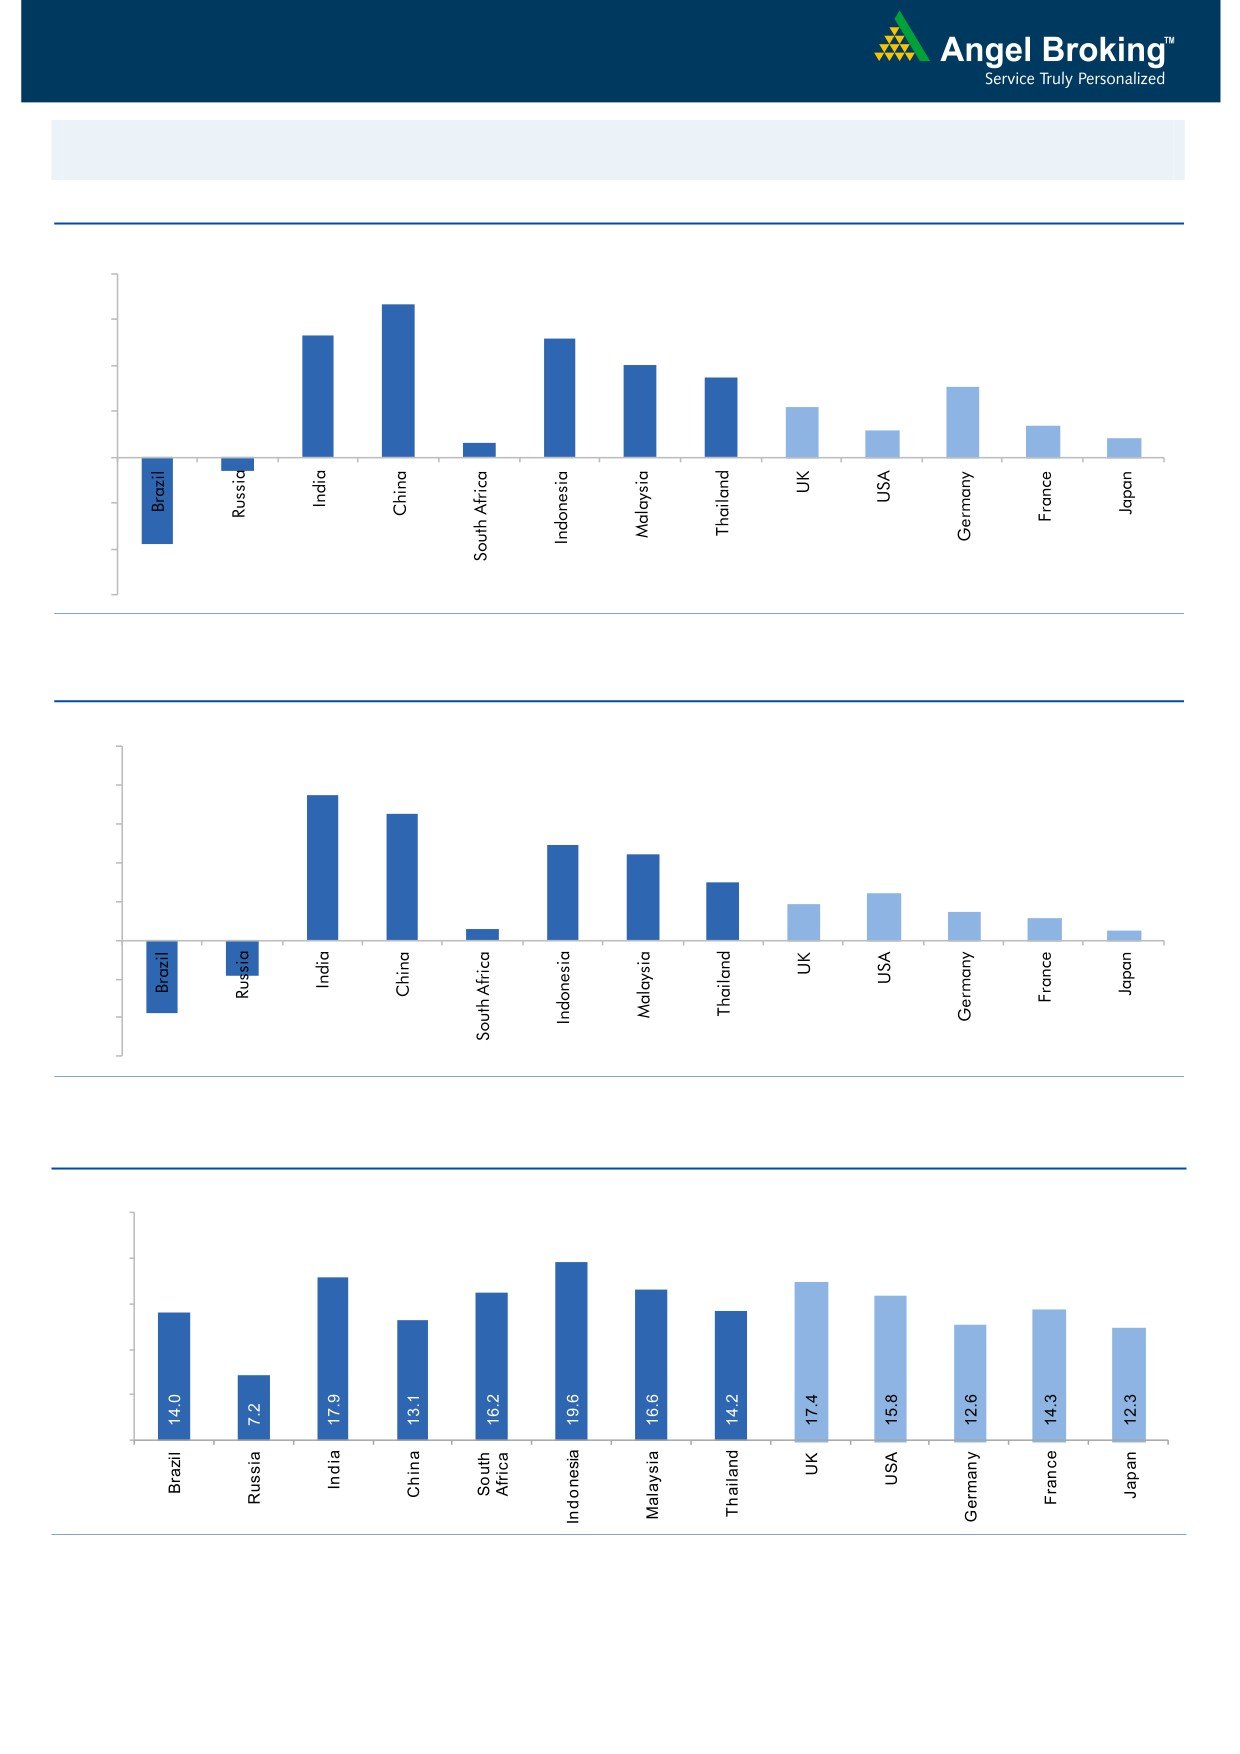
Global watch
Exhibit 1: Latest quarterly GDP Growth (%, yoy) across select developing and developed countries
(%)
8.0
6.7
6.0
5.3
0.6
5.2
4.0
3.5
4.0
3.1
2.2
1.4
2.0
1.2
0.8
-
(2.0)
(0.6)
(4.0)
(3.8)
(6.0)
Source: Bloomberg, Angel Research
Exhibit 2: 2016 GDP Growth projection by IMF (%, yoy) across select developing and developed countries
(%)
10.0
7.5
8.0
6.5
6.0
4.9
4.4
4.0
3.0
2.4
1.9
1.5
2.0
1.1
0.6
0.5
(3.8)
(1.8)
-
(2.0)
(4.0)
(6.0)
Source: IMF, Angel Research
Exhibit 3: One year forward P-E ratio across select developing and developed countries
(x)
25.0
20.0
15.0
10.0
5.0
-
Source: IMF, Angel Research
Market Outlook
September 30, 2016
Exhibit 4: Relative performance of indices across globe
Returns (%)
Country
Name of index
Closing price
1M
3M
1YR
Brazil
Bovespa
58,351
(0.4)
13.2
28.8
Russia
Micex
1,996
0.5
5.2
22.4
India
Nifty
8,591
0.2
6.1
7.7
China
Shanghai Composite
2,998
(2.2)
2.5
(5.8)
South Africa
Top 40
46,095
(1.5)
0.8
4.4
Mexico
Mexbol
47,672
0.2
3.7
11.7
Indonesia
LQ45
940
1.6
12.9
26.7
Malaysia
KLCI
1,670
(0.6)
2.2
1.8
Thailand
SET 50
950
(3.4)
5.9
5.2
USA
Dow Jones
18,143
(1.9)
2.5
11.5
UK
FTSE
6,919
1.4
6.4
12.9
Japan
Nikkei
16,465
2.0
9.0
(8.1)
Germany
DAX
10,406
(2.4)
6.4
6.0
France
CAC
4,444
(0.3)
4.0
(5.0)
Source: Bloomberg, Angel Research
Stock Watch
September 30, 2016
Company Name
Reco
CMP
Target
Mkt Cap
Sales ( Čcr )
OPM(%)
EPS (Č)
PER(x)
P/BV(x)
RoE(%)
EV/Sales(x)
(Č)
Price ( Č)
( Č cr )
FY17E FY18E
FY17E
FY18E
FY17E
FY18E
FY17E
FY18E
FY17E
FY18E
FY17E
FY18E
FY17E
FY18E
Agri / Agri Chemical
Rallis
Neutral
220
-
4,280
1,937
2,164
13.3
14.3
9.0
11.0
24.5
20.0
4.3
3.7
18.4
19.8
2.3
2.0
United Phosphorus
Accumulate
650
684
32,967
15,176
17,604
18.5
18.5
37.4
44.6
17.4
14.6
3.4
2.8
21.4
21.2
2.3
1.9
Auto & Auto Ancillary
Ashok Leyland
Buy
77
111
21,856
22,407
26,022
10.6
10.6
5.2
6.4
14.7
12.0
3.3
2.8
23.6
24.7
1.1
0.9
Bajaj Auto
Neutral
2,845
-
82,312
25,093
27,891
19.5
19.2
143.9
162.5
19.8
17.5
5.6
4.8
30.3
29.4
3.0
2.6
Bharat Forge
Neutral
897
-
20,889
7,726
8,713
20.5
21.2
35.3
42.7
25.4
21.0
4.7
4.2
18.9
20.1
2.8
2.4
Eicher Motors
Neutral
24,918
-
67,681
16,583
20,447
17.5
18.0
598.0
745.2
41.7
33.4
14.2
10.8
41.2
38.3
3.9
3.1
Gabriel India
Neutral
116
-
1,668
1,544
1,715
9.0
9.3
5.4
6.3
21.5
18.4
4.1
3.6
18.9
19.5
1.0
0.9
Hero Motocorp
Neutral
3,429
-
68,463
31,253
35,198
15.3
15.0
172.3
192.1
19.9
17.9
7.3
6.2
38.9
37.0
2.1
1.8
Jamna Auto Industries Neutral
206
-
1,643
1,486
1,620
9.8
9.9
15.0
17.2
13.7
12.0
3.0
2.5
21.8
21.3
1.2
1.1
L G Balakrishnan & Bros Neutral
546
-
857
1,302
1,432
11.6
11.9
43.7
53.0
12.5
10.3
1.8
1.6
13.8
14.2
0.8
0.7
Mahindra and Mahindra Neutral
1,364
-
84,733
46,534
53,077
11.6
11.7
67.3
78.1
20.3
17.5
3.3
2.9
15.4
15.8
1.8
1.5
Maruti
Neutral
5,436
-
164,203
69,186
82,217
14.7
14.4
198.5
241.4
27.4
22.5
5.3
4.3
20.2
20.0
2.1
1.7
Minda Industries
Neutral
280
-
2,221
2,728
3,042
9.0
9.1
68.2
86.2
4.1
3.3
0.9
0.7
23.8
24.3
0.9
0.7
Motherson Sumi
Neutral
306
-
43,000
45,896
53,687
7.8
8.3
13.0
16.1
23.5
19.0
7.6
6.0
34.7
35.4
1.0
0.8
Rane Brake Lining
Neutral
1,135
-
898
511
562
11.3
11.5
28.1
30.9
40.4
36.7
6.2
5.6
15.3
15.0
1.9
1.7
Setco Automotive
Neutral
40
-
536
741
837
13.0
13.0
15.2
17.0
2.6
2.4
0.4
0.4
15.8
16.3
1.1
1.0
Tata Motors
Neutral
526
-
151,925
300,209
338,549
8.9
8.4
42.7
54.3
12.3
9.7
2.0
1.7
15.6
17.2
0.6
0.5
TVS Motor
Neutral
348
-
16,540
13,390
15,948
6.9
7.1
12.8
16.5
27.3
21.0
6.8
5.4
26.3
27.2
1.3
1.0
Amara Raja Batteries
Buy
998
1,174
17,048
5,429
6,471
17.5
17.6
35.3
43.5
28.3
22.9
6.5
5.3
25.3
24.8
3.0
2.4
Exide Industries
Neutral
182
-
15,432
7,439
8,307
15.0
15.0
8.1
9.3
22.4
19.5
3.1
2.8
14.3
16.7
1.7
1.5
Apollo Tyres
Neutral
210
-
10,712
12,877
14,504
14.3
13.9
21.4
23.0
9.8
9.2
1.5
1.3
16.4
15.2
1.0
0.9
Ceat
Neutral
1,226
-
4,960
7,524
8,624
13.0
12.7
131.1
144.3
9.4
8.5
1.7
1.5
19.8
18.6
0.7
0.6
JK Tyres
Neutral
141
-
3,196
7,455
8,056
15.0
15.0
21.8
24.5
6.5
5.8
1.4
1.1
22.8
21.3
0.6
0.5
Swaraj Engines
Neutral
1,188
-
1,475
660
810
15.2
16.4
54.5
72.8
21.8
16.3
6.8
6.2
31.5
39.2
2.1
1.7
Subros
Neutral
124
-
741
1,488
1,681
11.7
11.9
6.4
7.2
19.3
17.2
2.0
1.9
10.8
11.4
0.7
0.6
Indag Rubber
Neutral
171
-
448
286
326
19.8
16.8
11.7
13.3
14.6
12.8
2.5
2.3
17.8
17.1
1.2
1.1
Capital Goods
ACE
Neutral
43
-
422
709
814
4.1
4.6
1.4
2.1
30.5
20.3
1.3
1.2
4.4
6.0
0.8
0.7
BEML
Buy
875
1,157
3,642
3,451
4,055
6.3
9.2
31.4
57.9
27.9
15.1
1.7
1.5
6.3
10.9
1.2
1.0
Bharat Electronics
Accumulate
1,232
1,414
29,575
8,137
9,169
16.8
17.2
58.7
62.5
21.0
19.7
3.3
2.9
44.6
46.3
2.6
2.3
Stock Watch
September 30, 2016
Company Name
Reco
CMP
Target
Mkt Cap
Sales ( Čcr )
OPM(%)
EPS (Č)
PER(x)
P/BV(x)
RoE(%)
EV/Sales(x)
(Č)
Price ( Č)
( Č cr )
FY17E
FY18E
FY17E
FY18E
FY17E
FY18E
FY17E
FY18E
FY17E
FY18E
FY17E
FY18E
FY17E
FY18E
Capital Goods
Voltas
Accumulate
368
407
12,183
6,511
7,514
7.9
8.7
12.9
16.3
28.5
22.6
5.1
4.5
16.7
18.5
1.6
1.4
BGR Energy
Neutral
109
-
788
16,567
33,848
6.0
5.6
7.8
5.9
14.0
18.5
0.8
0.8
4.7
4.2
0.1
0.1
BHEL
Neutral
133
-
32,578
28,797
34,742
-
2.8
2.3
6.9
57.9
19.3
1.0
1.0
1.3
4.8
0.8
0.5
Blue Star
Accumulate
545
578
5,200
4,351
5,024
6.4
7.1
17.2
20.6
31.8
26.4
20.7
17.2
23.1
24.1
1.2
1.1
Crompton Greaves
Neutral
74
-
4,647
5,777
6,120
5.9
7.0
3.3
4.5
22.5
16.5
1.0
0.9
4.4
5.9
0.8
0.6
Greaves Cotton
Neutral
127
-
3,106
1,755
1,881
16.8
16.9
7.8
8.5
16.3
15.0
3.3
3.0
20.6
20.9
1.5
1.3
Inox Wind
Buy
195
286
4,331
5,605
6,267
15.7
16.4
24.8
30.0
7.9
6.5
2.2
1.6
25.9
24.4
0.8
0.7
KEC International
Neutral
120
-
3,095
9,294
10,186
7.9
8.1
9.9
11.9
12.2
10.1
1.8
1.6
15.6
16.3
0.6
0.5
Thermax
Neutral
851
-
10,134
5,421
5,940
7.3
7.3
25.7
30.2
33.1
28.2
4.0
3.7
12.2
13.1
1.8
1.6
VATech Wabag
Buy
545
681
2,972
3,136
3,845
8.9
9.1
26.0
35.9
21.0
15.2
2.6
2.2
13.4
15.9
0.9
0.7
Cement
ACC
Neutral
1,587
-
29,803
11,225
13,172
13.2
16.9
44.5
75.5
35.7
21.0
3.4
3.1
11.2
14.2
2.7
2.3
Ambuja Cements
Neutral
255
-
50,614
9,350
10,979
18.2
22.5
5.8
9.5
44.0
26.8
3.7
3.3
10.2
12.5
5.4
4.6
India Cements
Neutral
140
-
4,302
4,364
4,997
18.5
19.2
7.9
11.3
17.7
12.4
1.3
1.2
8.0
8.5
1.7
1.5
JK Cement
Neutral
824
-
5,765
4,398
5,173
15.5
17.5
31.2
55.5
26.4
14.9
3.2
2.8
12.0
15.5
1.9
1.5
J K Lakshmi Cement
Neutral
487
-
5,736
2,913
3,412
14.5
19.5
7.5
22.5
65.0
21.7
4.0
3.4
12.5
18.0
2.6
2.1
Orient Cement
Neutral
208
-
4,260
2,114
2,558
18.5
20.5
8.1
11.3
25.7
18.4
3.8
3.2
9.0
14.0
2.6
2.1
UltraTech Cement
Neutral
3,858
-
105,871
25,768
30,385
21.0
23.5
111.0
160.0
34.8
24.1
4.4
3.9
13.5
15.8
4.2
3.5
Construction
ITNL
Neutral
95
-
3,137
8,946
10,017
31.0
31.6
8.1
9.1
11.8
10.5
0.4
0.4
4.2
5.0
3.7
3.4
KNR Constructions
Accumulate
741
802
2,084
1,385
1,673
14.7
14.0
41.2
48.5
18.0
15.3
3.4
2.9
14.9
15.2
1.6
1.3
Larsen & Toubro
Buy
1,437
1,700
133,883
67,665
77,249
10.7
11.5
57.3
71.2
25.1
20.2
2.3
2.2
12.6
14.3
2.2
1.9
Gujarat Pipavav Port
Neutral
170
-
8,240
705
788
52.2
51.7
5.0
5.6
34.1
30.4
3.4
3.0
11.2
11.2
11.3
9.7
Nagarjuna Const.
Neutral
80
-
4,428
8,842
9,775
9.1
8.8
5.3
6.4
15.0
12.5
1.2
1.1
8.2
9.1
0.7
0.6
PNC Infratech
Buy
113
143
2,900
2,350
2,904
13.1
13.2
9.0
8.8
12.6
12.9
0.5
0.4
15.9
13.9
1.4
1.1
Simplex Infra
Neutral
318
-
1,572
6,829
7,954
10.5
10.5
31.4
37.4
10.1
8.5
1.1
1.0
9.9
13.4
0.7
0.6
Power Mech Projects
Neutral
472
-
694
1,801
2,219
12.7
14.6
72.1
113.9
6.5
4.1
1.2
1.0
16.8
11.9
0.4
0.3
Sadbhav Engineering
Neutral
286
-
4,901
3,598
4,140
10.3
10.6
9.0
11.9
31.7
24.0
3.3
2.9
9.9
11.9
1.6
1.4
NBCC
Neutral
251
-
15,042
7,428
9,549
7.9
8.6
8.2
11.0
30.6
22.8
1.5
1.2
28.2
28.7
1.7
1.3
MEP Infra
Neutral
40
-
647
1,877
1,943
30.6
29.8
3.0
4.2
13.3
9.5
6.4
4.3
0.6
0.6
1.7
1.6
SIPL
Neutral
105
-
3,698
1,036
1,252
65.5
66.2
(8.4)
(5.6)
3.9
4.5
(22.8)
(15.9)
11.8
9.8
Stock Watch
September 30, 2016
Company Name
Reco
CMP
Target
Mkt Cap
Sales ( Čcr )
OPM(%)
EPS (Č)
PER(x)
P/BV(x)
RoE(%)
EV/Sales(x)
(Č)
Price ( Č)
( Č cr )
FY17E
FY18E
FY17E
FY18E
FY17E
FY18E
FY17E
FY18E
FY17E
FY18E
FY17E
FY18E
FY17E
FY18E
Construction
Engineers India
Neutral
241
-
8,117
1,725
1,935
16.0
19.1
11.4
13.9
21.1
17.3
2.9
2.8
13.4
15.3
3.6
3.3
Financials
Axis Bank
Neutral
539
-
128,587
58,081
66,459
3.5
3.5
32.4
44.6
16.7
12.1
2.2
1.9
13.6
16.5
-
-
Bank of Baroda
Neutral
162
-
37,270
19,980
23,178
1.8
1.8
11.5
17.3
14.1
9.4
1.6
1.3
8.3
10.1
-
-
Canara Bank
Neutral
298
-
16,154
15,225
16,836
1.8
1.8
14.5
28.0
20.5
10.6
1.4
1.1
5.8
8.5
-
-
Dewan Housing Finance Buy
273
325
7,953
2,225
2,688
2.9
2.9
29.7
34.6
9.2
7.9
1.5
1.3
16.1
16.8
-
-
Equitas Holdings
Buy
170
235
5,690
939
1,281
11.7
11.5
5.8
8.2
29.3
20.7
2.5
2.2
10.9
11.5
-
-
Federal Bank
Neutral
70
-
12,087
9,353
10,623
2.9
2.9
4.4
5.8
16.0
12.1
1.5
1.4
9.5
11.0
-
-
HDFC
Neutral
1,400
-
221,351
11,475
13,450
3.4
3.4
45.3
52.5
30.9
26.7
6.0
5.3
20.2
20.5
-
-
HDFC Bank
Accumulate
1,277
1,350
323,316
46,097
55,433
4.5
4.5
58.4
68.0
21.9
18.8
3.8
3.2
18.8
18.6
-
-
ICICI Bank
Neutral
251
-
146,005
39,029
45,903
3.3
3.3
16.7
16.3
15.0
15.4
1.9
1.7
10.1
12.4
-
-
LIC Housing Finance
Neutral
565
-
28,503
3,712
4,293
2.6
2.5
39.0
46.0
14.5
12.3
2.7
2.3
19.9
20.1
-
-
Punjab Natl.Bank
Neutral
137
-
29,111
23,532
23,595
2.3
2.4
6.8
12.6
20.1
10.9
3.1
2.2
3.3
6.5
-
-
RBL Bank
Accumulate
286
325
10,573
1,783
2,309
2.6
2.6
12.7
16.4
22.5
17.4
2.5
2.2
12.8
13.3
-
-
South Ind.Bank
Neutral
22
-
2,903
6,435
7,578
2.5
2.5
2.7
3.1
8.0
6.9
1.0
0.9
10.1
11.2
-
-
St Bk of India
Neutral
247
-
191,857
88,650
98,335
2.6
2.6
13.5
18.8
18.3
13.2
1.7
1.5
7.0
8.5
-
-
Union Bank
Neutral
136
-
9,325
13,450
14,925
2.3
2.3
25.5
34.5
5.3
3.9
0.8
0.7
7.5
10.2
-
-
Yes Bank
Neutral
1,231
-
51,806
8,978
11,281
3.3
3.4
74.0
90.0
16.6
13.7
3.2
2.7
17.0
17.2
-
-
FMCG
Asian Paints
Neutral
1,168
-
112,030
17,128
18,978
16.8
16.4
19.1
20.7
61.2
56.4
21.3
20.1
34.8
35.5
6.5
5.8
Britannia
Neutral
3,283
-
39,386
9,795
11,040
14.6
14.9
80.3
94.0
40.9
34.9
16.8
13.0
41.2
-
3.9
3.4
Colgate
Neutral
976
-
26,534
4,605
5,149
23.4
23.4
23.8
26.9
41.0
36.3
22.7
17.7
64.8
66.8
5.7
5.1
Dabur India
Neutral
270
-
47,506
8,315
9,405
19.8
20.7
8.1
9.2
33.3
29.4
9.3
7.7
31.6
31.0
5.4
4.7
GlaxoSmith Con*
Neutral
6,017
-
25,304
4,350
4,823
21.2
21.4
179.2
196.5
33.6
30.6
8.9
7.6
27.1
26.8
5.2
4.6
Godrej Consumer
Neutral
1,577
-
53,709
10,235
11,428
18.4
18.6
41.1
44.2
38.4
35.7
8.5
7.2
24.9
24.8
5.3
4.7
HUL
Neutral
878
-
189,934
35,252
38,495
17.6
17.4
20.4
21.9
43.0
40.1
35.3
31.0
82.2
77.3
5.2
4.8
ITC
Buy
246
283
296,399
40,059
44,439
39.0
39.2
9.1
10.1
27.0
24.3
7.4
6.5
27.2
26.5
6.9
6.2
Marico
Neutral
271
-
35,002
6,430
7,349
18.8
19.5
6.4
7.7
42.4
35.2
12.8
10.8
33.2
32.5
5.3
4.5
Nestle*
Neutral
6,336
-
61,085
10,073
11,807
20.7
21.5
124.8
154.2
50.8
41.1
20.8
18.7
34.8
36.7
5.9
5.0
Tata Global
Neutral
137
-
8,646
8,675
9,088
9.8
9.8
7.4
8.2
18.5
16.7
2.1
2.0
7.9
8.1
0.9
0.9
Procter & Gamble
Accumulate
6,712
7,369
21,788
2,939
3,342
23.2
23.0
146.2
163.7
45.9
41.0
102.8
98.6
25.3
23.5
7.0
6.0
Hygiene
Stock Watch
September 30, 2016
Company Name
Reco
CMP
Target
Mkt Cap
Sales ( Čcr )
OPM(%)
EPS (Č)
PER(x)
P/BV(x)
RoE(%)
EV/Sales(x)
(Č)
Price ( Č)
( Č cr )
FY17E FY18E
FY17E
FY18E
FY17E
FY18E
FY17E
FY18E
FY17E
FY18E
FY17E
FY18E
FY17E
FY18E
IT
HCL Tech^
Buy
792
1,000
111,795
49,242
57,168
20.5
20.5
55.7
64.1
14.2
12.4
2.9
2.2
20.3
17.9
2.1
1.7
Infosys
Buy
1,030
1,370
236,562
69,934
79,025
27.5
27.5
64.8
72.0
15.9
14.3
3.5
3.2
22.0
22.3
2.8
2.5
TCS
Buy
2,435
3,004
479,720
121,684
136,286
27.3
27.3
135.0
150.1
18.0
16.2
6.0
5.5
33.2
33.9
3.7
3.3
Tech Mahindra
Buy
427
700
41,478
30,347
33,685
17.0
17.0
37.5
41.3
11.4
10.4
2.5
2.1
21.8
20.7
1.1
0.9
Wipro
Buy
472
680
114,840
51,631
55,822
21.7
17.9
35.9
36.9
13.2
12.8
2.7
2.5
19.0
18.1
1.9
1.7
Media
D B Corp
Neutral
392
-
7,205
2,297
2,590
27.4
28.2
21.0
23.4
18.7
16.8
4.4
3.8
23.7
23.1
2.9
2.5
HT Media
Neutral
80
-
1,861
2,693
2,991
12.6
12.9
7.9
9.0
10.1
8.9
0.9
0.8
7.8
8.3
0.3
0.2
Jagran Prakashan
Buy
183
225
5,989
2,355
2,635
28.0
28.0
10.8
12.5
17.0
14.7
3.7
3.2
21.7
21.7
2.6
2.2
Sun TV Network
Neutral
482
-
18,985
2,850
3,265
70.1
71.0
26.2
30.4
18.4
15.9
4.7
4.2
24.3
25.6
6.3
5.3
Hindustan Media
Neutral
285
-
2,088
1,016
1,138
24.3
25.2
27.3
30.1
10.4
9.5
2.0
1.8
16.2
15.8
1.4
1.2
Ventures
TV Today Network
Buy
297
363
1,773
637
743
27.5
27.5
18.4
21.4
16.2
13.9
2.8
2.4
17.4
17.2
2.4
2.0
Metals & Mining
Coal India
Neutral
327
-
206,735
84,638
94,297
21.4
22.3
24.5
27.1
13.4
12.1
5.6
5.3
42.6
46.0
2.0
1.8
Hind. Zinc
Neutral
228
-
96,274
14,252
18,465
55.9
48.3
15.8
21.5
14.4
10.6
2.4
2.1
17.0
20.7
6.8
5.2
Hindalco
Neutral
150
-
30,995
107,899
112,095
7.4
8.2
9.2
13.0
16.3
11.6
0.8
0.7
4.8
6.6
0.8
0.8
JSW Steel
Neutral
1,681
-
40,629
53,201
58,779
16.1
16.2
130.6
153.7
12.9
10.9
1.7
1.5
14.0
14.4
1.5
1.3
NMDC
Neutral
103
-
40,638
6,643
7,284
44.4
47.7
7.1
7.7
14.4
13.3
1.3
1.2
8.8
9.2
3.9
3.5
SAIL
Neutral
45
-
18,668
47,528
53,738
(0.7)
2.1
(1.9)
2.6
17.4
0.5
0.5
(1.6)
3.9
1.2
1.1
Vedanta
Neutral
169
-
49,985
71,744
81,944
19.2
21.7
13.4
20.1
12.6
8.4
1.1
1.0
8.4
11.3
1.1
0.8
Tata Steel
Neutral
368
-
35,726
121,374
121,856
7.2
8.4
18.6
34.3
19.8
10.7
1.2
1.1
6.1
10.1
0.9
0.9
Oil & Gas
Cairn India
Neutral
197
-
36,897
9,127
10,632
4.3
20.6
8.8
11.7
22.4
16.8
0.7
0.7
3.3
4.2
5.5
4.5
GAIL
Neutral
363
-
46,039
56,220
65,198
9.3
10.1
27.1
33.3
13.4
10.9
1.2
1.1
9.3
10.7
1.0
0.8
ONGC
Neutral
251
-
214,914
137,222
152,563
15.0
21.8
19.5
24.1
12.9
10.4
1.1
1.0
8.5
10.1
1.8
1.6
Indian Oil Corp
Neutral
574
-
139,243
373,359
428,656
5.9
5.5
54.0
59.3
10.6
9.7
1.6
1.5
16.0
15.6
0.5
0.5
Reliance Industries
Neutral
1,073
-
347,768
301,963
358,039
12.1
12.6
87.7
101.7
12.2
10.6
1.3
1.1
10.7
11.3
1.6
1.4
Pharmaceuticals
Alembic Pharma
Neutral
651
-
12,270
3,483
4,083
20.2
21.4
24.3
30.4
26.8
21.4
6.1
4.9
25.5
25.3
3.5
2.9
Aurobindo Pharma
Accumulate
825
877
48,279
15,720
18,078
23.7
23.7
41.4
47.3
19.9
17.4
5.2
4.1
29.6
26.1
3.3
2.9
Aventis*
Neutral
4,146
-
9,547
2,357
2,692
17.3
17.3
153.5
169.2
27.0
24.5
4.6
3.7
25.8
28.4
3.7
3.0
Cadila Healthcare
Neutral
386
-
39,476
11,126
13,148
22.0
22.0
17.1
20.0
22.6
19.3
5.8
4.6
28.8
26.6
3.6
2.9
Cipla
Sell
601
490
48,286
15,378
18,089
17.4
18.4
21.6
27.2
27.8
22.1
3.6
3.1
13.7
15.2
3.3
2.8
Stock Watch
September 30, 2016
Company Name
Reco
CMP
Target
Mkt Cap
Sales ( Čcr )
OPM(%)
EPS (Č)
PER(x)
P/BV(x)
RoE(%)
EV/Sales(x)
(Č)
Price ( Č)
( Č cr )
FY17E FY18E
FY17E
FY18E
FY17E
FY18E
FY17E
FY18E
FY17E
FY18E
FY17E
FY18E
FY17E
FY18E
Pharmaceuticals
Dr Reddy's
Neutral
3,137
-
51,980
16,043
18,119
23.1
24.7
126.0
157.8
24.9
19.9
3.7
3.2
15.7
17.1
3.2
2.8
Dishman Pharma
Sell
224
45
3,609
1,718
1,890
22.7
22.8
9.5
11.3
23.5
19.8
2.3
2.1
10.1
10.9
2.6
2.2
GSK Pharma*
Neutral
2,805
-
23,755
3,528
3,811
16.6
18.8
51.8
59.4
54.1
47.2
14.5
14.4
26.3
30.6
6.5
6.1
Indoco Remedies
Sell
315
225
2,902
1,112
1,289
18.2
18.2
13.2
15.6
23.9
20.2
4.2
3.6
19.2
19.2
2.7
2.3
Ipca labs
Neutral
601
-
7,580
3,303
3,799
15.3
15.3
17.3
19.7
34.7
30.5
3.0
2.8
9.1
9.4
2.4
2.1
Lupin
Buy
1,470
1,809
66,251
15,912
18,644
26.4
26.7
58.1
69.3
25.3
21.2
4.9
4.0
21.4
20.9
4.2
3.5
Sun Pharma
Buy
737
944
177,385
31,129
35,258
30.0
30.9
28.0
32.8
26.3
22.5
4.0
3.4
18.7
18.9
5.3
4.5
Power
Tata Power
Neutral
74
-
19,920
36,916
39,557
17.4
27.1
5.1
6.3
14.4
11.7
1.3
1.2
9.0
10.3
1.6
1.4
NTPC
Neutral
150
-
123,311
86,605
95,545
17.5
20.8
11.8
13.4
12.7
11.2
1.3
1.2
10.5
11.1
2.8
2.8
Power Grid
Neutral
174
-
90,820
25,763
29,762
74.3
73.1
14.8
17.3
11.7
10.0
1.8
1.6
16.9
17.5
7.8
7.4
Real Estate
Prestige Estate
Accumulate
190
210
7,106
4,707
5,105
25.2
26.0
10.3
13.0
18.4
14.6
1.5
1.4
10.3
10.2
2.7
2.4
MLIFE
Buy
428
522
1,755
1,152
1,300
22.7
24.6
29.9
35.8
14.3
12.0
1.1
1.0
7.6
8.6
2.2
1.9
Telecom
Bharti Airtel
Neutral
316
-
126,118
105,086
114,808
34.5
34.7
12.2
16.4
25.9
19.2
1.8
1.6
6.8
8.4
2.1
1.8
Idea Cellular
Neutral
80
-
28,662
40,133
43,731
37.2
37.1
6.4
6.5
12.4
12.3
1.0
1.0
8.2
7.6
1.7
1.5
zOthers
Abbott India
Neutral
4,616
-
9,808
3,153
3,583
14.1
14.4
152.2
182.7
30.3
25.3
148.9
127.2
25.6
26.1
2.8
2.4
Bajaj Electricals
Buy
252
306
2,546
5,099
5,805
5.6
5.9
11.4
14.6
22.2
17.3
3.0
2.6
13.4
15.1
0.5
0.4
Finolex Cables
Neutral
445
-
6,800
2,883
3,115
12.0
12.1
14.2
18.6
31.3
23.9
16.7
14.6
15.8
14.6
2.1
1.9
Goodyear India*
Accumulate
643
684
1,484
1,598
1,704
10.4
10.2
49.4
52.6
13.0
12.2
60.1
52.8
18.2
17.0
0.6
83.7
Hitachi
Neutral
1,530
-
4,160
2,081
2,433
8.8
8.9
33.4
39.9
45.8
38.4
37.0
30.8
22.1
21.4
2.0
1.7
Jyothy Laboratories
Neutral
333
-
6,029
1,440
2,052
11.5
13.0
8.5
10.0
39.2
33.3
9.5
8.8
18.6
19.3
4.5
3.1
Page Industries
Neutral
14,943
-
16,667
2,450
3,124
20.1
17.6
299.0
310.0
50.0
48.2
332.8
254.1
47.1
87.5
6.9
5.4
Relaxo Footwears
Neutral
439
-
5,273
2,085
2,469
9.2
8.2
7.6
8.0
58.1
55.3
22.5
19.2
17.9
18.8
2.6
2.2
Siyaram Silk Mills
Buy
1,265
1,469
1,186
1,799
2,040
11.6
11.7
104.9
122.4
12.1
10.3
2.0
1.7
16.4
16.4
0.9
0.8
Styrolution ABS India*
Neutral
571
-
1,004
1,440
1,537
9.2
9.0
40.6
42.6
14.1
13.4
35.9
32.6
12.3
11.6
0.7
0.6
TVS Srichakra
Neutral
3,671
-
2,811
2,304
2,614
13.7
13.8
231.1
266.6
15.9
13.8
412.5
324.8
33.9
29.3
1.2
1.1
HSIL
Neutral
335
-
2,423
2,384
2,515
15.8
16.3
15.3
19.4
21.9
17.3
21.8
18.7
7.8
9.3
1.2
1.1
Kirloskar Engines India
Neutral
332
-
4,801
2,554
2,800
9.9
10.0
10.5
12.1
31.6
27.4
13.2
12.5
10.7
11.7
1.5
1.3
Ltd
M M Forgings
Neutral
411
-
496
546
608
20.4
20.7
41.3
48.7
10.0
8.4
56.2
49.8
16.6
17.0
0.8
0.7
Banco Products (India)
Neutral
205
-
1,467
1,353
1,471
12.3
12.4
14.5
16.3
14.2
12.6
19.5
17.6
14.5
14.6
1.0
109.9
Stock Watch
September 30, 2016
Company Name
Reco
CMP
Target
Mkt Cap
Sales ( Čcr )
OPM(%)
EPS (Č)
PER(x)
P/BV(x)
RoE(%)
EV/Sales(x)
(Č)
Price ( Č)
( Č cr )
FY17E
FY18E
FY17E
FY18E
FY17E
FY18E
FY17E
FY18E
FY17E
FY18E
FY17E
FY18E
FY17E
FY18E
zOthers
Competent Automobiles Neutral
187
-
115
1,137
1,256
3.1
2.7
28.0
23.6
6.7
7.9
36.0
32.5
14.3
11.5
0.1
0.1
Nilkamal
Neutral
1,268
-
1,892
1,995
2,165
10.7
10.4
69.8
80.6
18.2
15.7
72.5
63.0
16.6
16.5
0.9
0.8
Visaka Industries
Neutral
184
-
292
1,051
1,138
10.3
10.4
21.0
23.1
8.8
8.0
23.6
22.1
9.0
9.2
0.5
0.5
Transport Corporation of
Neutral
183
-
1,404
2,671
2,911
8.5
8.8
13.9
15.7
13.2
11.7
1.8
1.6
13.7
13.8
0.6
0.6
India
Elecon Engineering
Accumulate
57
63
617
1,482
1,660
13.7
14.5
3.9
5.8
14.5
9.8
3.4
3.1
7.8
10.9
0.7
0.6
Surya Roshni
Neutral
204
-
896
3,342
3,625
7.8
7.5
17.3
19.8
11.8
10.3
22.5
18.0
10.5
10.8
0.5
0.5
MT Educare
Neutral
127
-
505
366
417
17.7
18.2
9.4
10.8
13.5
11.7
3.0
2.6
22.2
22.3
1.3
1.1
Radico Khaitan
Accumulate
112
125
1,495
1,659
1,802
13.0
13.2
6.3
7.4
17.7
15.2
1.5
1.4
8.6
9.3
1.3
1.2
Garware Wall Ropes
Accumulate
499
524
1,092
873
938
12.9
13.1
30.9
34.9
16.2
14.3
2.5
2.2
15.7
15.2
1.2
1.1
Wonderla Holidays
Neutral
370
-
2,093
287
355
38.0
40.0
11.3
14.2
32.8
26.1
4.7
4.1
21.4
23.9
7.0
5.7
Linc Pen & Plastics
Accumulate
260
283
384
382
420
9.3
9.5
13.5
15.7
19.3
16.5
3.3
2.9
17.1
17.3
1.1
1.0
The Byke Hospitality
Neutral
180
-
721
287
384
20.5
20.5
7.6
10.7
23.7
16.8
4.9
4.0
20.7
23.5
2.5
1.9
Interglobe Aviation
Neutral
904
-
32,564
21,122
26,005
14.5
27.6
110.7
132.1
8.2
6.8
48.9
34.9
168.5
201.1
1.5
1.2
Coffee Day Enterprises
Neutral
222
-
4,579
2,964
3,260
20.5
21.2
4.7
8.0
-
27.8
2.6
2.4
5.5
8.5
2.0
1.7
Ltd
Navneet Education
Neutral
99
-
2,364
1,062
1,147
24.0
24.0
6.1
6.6
16.3
15.0
3.4
3.0
20.6
19.8
2.3
2.1
Navkar Corporation
Buy
182
265
2,593
408
612
42.9
42.3
6.8
11.5
26.8
15.8
1.9
1.7
6.9
10.5
7.3
4.8
UFO Moviez
Neutral
452
-
1,249
619
685
33.2
33.4
30.0
34.9
15.1
13.0
2.1
1.8
13.8
13.9
1.7
1.4
VRL Logistics
Neutral
300
-
2,737
1,902
2,119
16.7
16.6
14.6
16.8
20.6
17.8
4.5
4.0
21.9
22.2
1.6
1.4
Team Lease Serv.
Neutral
1,067
-
1,823
3,229
4,001
1.5
1.8
22.8
32.8
46.8
32.5
5.0
4.4
10.7
13.4
0.5
0.4
S H Kelkar & Co.
Neutral
305
-
4,417
1,036
1,160
15.1
15.0
6.1
7.2
50.0
42.6
5.3
4.9
10.7
11.5
4.1
3.7
Quick Heal
Neutral
217
-
1,520
408
495
27.3
27.0
7.7
8.8
28.0
24.7
2.6
2.6
9.3
10.6
2.9
2.4
Narayana Hrudaya
Neutral
324
-
6,611
1,873
2,166
11.5
11.7
2.6
4.0
122.3
81.6
7.5
6.8
6.1
8.3
3.6
3.1
Manpasand Bever.
Neutral
747
-
3,740
836
1,087
19.6
19.4
16.9
23.8
44.2
31.4
5.3
4.6
12.0
14.8
4.2
3.2
Parag Milk Foods
Neutral
290
-
2,442
1,919
2,231
9.3
9.6
9.5
12.9
30.7
22.4
4.8
3.9
15.5
17.5
1.4
1.2
Mirza International
Buy
88
113
1,064
1,024
1,148
18.0
18.0
6.9
8.0
12.8
11.1
2.2
1.8
16.6
16.2
1.2
1.1
Source: Company, Angel Research; Note: *December year end; #September year end; &October year end; Price as on September 29, 2016
Market Outlook
September 30, 2016
Research Team Tel: 022 - 39357800
DISCLAIMER
Angel Broking Private Limited (hereinafter referred to as “Angel”) is a registered Member of National Stock Exchange of India
Limited,Bombay Stock Exchange Limited and Metropolitan Stock Exchange Limited. It is also registered as a Depository Participant with
CDSL and Portfolio Manager with SEBI. It also has registration with AMFI as a Mutual Fund Distributor. Angel Broking Private Limited is a
registered entity with SEBI for Research Analyst in terms of SEBI (Research Analyst) Regulations, 2014 vide registration number
INH000000164. Angel or its associates has not been debarred/ suspended by SEBI or any other regulatory authority for accessing
/dealing in securities Market. Angel or its associates/analyst has not received any compensation / managed or
co-managed public offering of securities of the company covered by Analyst during the past twelve months.
This document is solely for the personal information of the recipient, and must not be singularly used as the basis of any investment
decision. Nothing in this document should be construed as investment or financial advice. Each recipient of this document should make
such investigations as they deem necessary to arrive at an independent evaluation of an investment in the securities of the companies
referred to in this document (including the merits and risks involved), and should consult their own advisors to determine the merits and
risks of such an investment.
Reports based on technical and derivative analysis center on studying charts of a stock's price movement, outstanding positions and
trading volume, as opposed to focusing on a company's fundamentals and, as such, may not match with a report on a company's
fundamentals. Investors are advised to refer the Fundamental and Technical Research Reports available on our website to evaluate the
contrary view, if any.
The information in this document has been printed on the basis of publicly available information, internal data and other reliable
sources believed to be true, but we do not represent that it is accurate or complete and it should not be relied on as such, as this
document is for general guidance only. Angel Broking Pvt. Limited or any of its affiliates/ group companies shall not be in any way
responsible for any loss or damage that may arise to any person from any inadvertent error in the information contained in this report.
Angel Broking Pvt. Limited has not independently verified all the information contained within this document. Accordingly, we cannot
testify, nor make any representation or warranty, express or implied, to the accuracy, contents or data contained within this document.
While Angel Broking Pvt. Limited endeavors to update on a reasonable basis the information discussed in this material, there may be
regulatory, compliance, or other reasons that prevent us from doing so.
This document is being supplied to you solely for your information, and its contents, information or data may not be reproduced,
redistributed or passed on, directly or indirectly.
Neither Angel Broking Pvt. Limited, nor its directors, employees or affiliates shall be liable for any loss or damage that may arise from
or in connection with the use of this information.